Gantt chart

What is a Gantt chart?
A Gantt chart is a horizontal bar chart developed as a production control tool in 1917 by Henry L. Gantt, an American engineer and social scientist. Frequently used in project management, a Gantt chart provides a graphical illustration of a schedule that can be used to plan, coordinate and track tasks in a project.
Gantt charts can be simple versions created on graph paper or more complex automated versions created using project management applications such as Microsoft Project or Excel.
History of the Gantt chart
Karol Adamiecki, a Polish mechanical engineer and professor, is credited with devising what would become the first Gantt chart in 1896. He developed the law of harmony in management. It emphasizes the importance of good teams, scheduling and using compatible production tools.
Adamiecki created the harmonogram, a precursor of the Gantt chart. It was not published until 1931 and was only published in Polish.
In 1917, American engineer Henry L. Gantt used Adamiecki's harmonogram as inspiration for his own chart. The Gantt chart became popular as a way to describe resource loading and production planning in factories. It was also useful for gauging employee productivity.
Early Gantt charts were made of physical materials like paper and blocks. Some of the earliest ones were used in World War I at munitions manufacturing plants to help manage the unprecedented production requirements to support war efforts.
Until the 1980s, Gantt charts were limited in complexity and were hand-drawn. Computers enabled more complex Gantt charts. They also made the charts easier to change and suitable for more applications. Today, Gantt charts are widely used as part of project management software.
What are Gantt charts used for?
Gantt charts are one of the many project management tools. They present in one chart all the tasks in a project. They show the order in which they tasks should be done and the time needed to complete them. This is valuable information to have when managing projects for the following reasons:
- Progress monitoring. Project managers can see if individual tasks are completed on time and adjust the project schedule. The charts also show which goals were met on schedule, helping managers gauge employee productivity.
- Project planning. Managers can set deadlines, milestones and schedules for various project components.
- Resource management. Project planners can coordinate resource allocation with the project schedule. Managers can see the amount of time each process takes and designate resources accordingly.
Both the Waterfall and Agile project management methodologies make use of Gantt charts. Because they display project information linearly, they work particularly well with Waterfall, where customer expectations are collected at the beginning of a project, and a linear plan is devised to meet them.
Project teams using the Agile approach set their own goals and use continuous customer feedback to update their plan in real time. Gantt charts can be useful in Agile to compare an old plan to a proposed change and to see what effect the change has on the overall plan.
How to build a Gantt chart
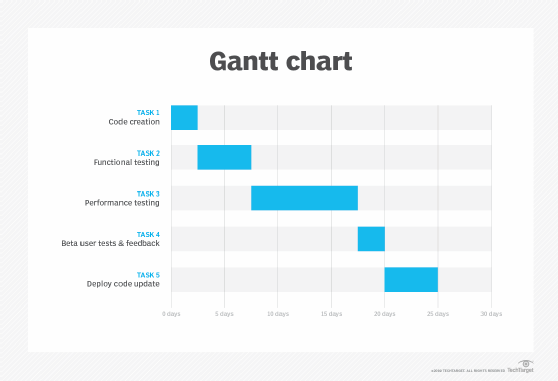
A Gantt chart is constructed with a horizontal axis representing the total time span of the project, broken down into increments -- days, weeks or months. It has a vertical axis representing the project tasks. For example, if the project is choosing new HR software, major tasks might be: conduct research, choose software and install software.
Horizontal bars of varying lengths represent the sequences, timing, and time span for each task. Using the same example, put "conduct research" at the top of the vertical axis and draw a bar on the graph that represents the amount of time anticipated for the research, then enter the other tasks below the first one with representative bars at the points in time when they'll be undertaken.
The bar spans may overlap. For example, conducting research and choosing software may happen during the same time span. As the project progresses, secondary bars, arrowheads or darkened bars may be added to indicate completed tasks, or the portions of tasks completed. A vertical line is used to represent the report date.
Gantt charts can also be created using software like Microsoft Excel. With some programming knowledge, JavaScript can be used. It has several chart libraries that work well for data visualization.
What are the benefits of using a Gantt chart?
Some benefits of using a Gantt chart include the following:
- Efficiency. Gantt charts help project managers calculate realistic project completion times and set goals based on available resources. Both of these advantages increase productivity.
- Teamwork. Team members have access to the same information, keeping everyone informed of a project's progress. Because of this, it's possible to hold all team members, including remote workers, accountable for their tasks. Team members can reference the chart and establish roles and responsibilities.
- Tracking. Gantt charts allow project planners and team members to analyze workflows for constraints and adjust their work accordingly. Gantt charts help project managers track benchmarks and tasks throughout the project process. Team members can easily visualize which elements may be missing from the Gantt chart.
- Versatility. Gantt charts help teams balance multiple projects at once. They prompt managers to estimate which resources are needed when. They are also easy to change.
- Visualization. Gantt charts provide a project roadmap at a glance, allowing for easier management, monitoring and organization of project components. The chart gives a holistic view of the project timeline and tasks. It also provides high-level visibility into the who, what, when and where of a project. Employees can quickly see the status of the project or a project phase.
Gantt chart limitations
Gantt charts are useful project management tools, but they have flaws, such as the following:
- Lack of dependencies. Gantt charts don't indicate task dependencies or critical paths of projects in detail. Users cannot tell how one task falling behind schedule affects other tasks. The PERT chart, another popular project management method, is designed to do this.
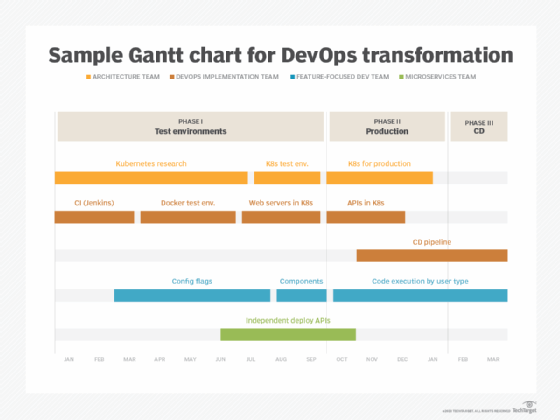
- Lack of specificity. Gantt charts are good for providing a high-level view of project workflows. However, they can leave some things to interpretation. This is especially true for large-scale IT projects, such as DevOps Certain details about priorities, deadlines and expectations may be left out of the high-level view of complex projects.
- Quantity of work. A third issue with Gantt charts is that the task bar doesn't show the quantity of work each task requires. It may show a specific length of time, which roughly implies a certain amount of resources. However, it does not designate the resources. That creates ambiguity and can lead to resource contention.
Gantt chart software
A variety of project management tools can function as Gantt chart software. Examples include:
- Asana
- Atlassian Jira
- Citrix Systems Wrike
- Gantto
- Microsoft Excel
- Microsoft Project
- Microsoft SharePoint
- Microsoft Visio
- Matchware
- Smartsheet
- Workzone
Not all of these tools are exclusively for creating Gantt charts. Some of them support other functions and contain features that let users create Gantt charts. For example, Jira is a project management and application lifecycle management tool that contains a Gantt chart feature. On the other hand, Gantto is largely dedicated to creating and sharing Gantt charts.
Certain applications that are used for creating Gantt charts can also be used for team collaboration. Learn the five steps organizations can take to better manage team collaboration applications.