What is APM? Application performance monitoring guide
Application performance monitoring (APM) is the collection of tools and processes designed to help IT professionals ensure that enterprise applications meet the performance, reliability and valuable user experience (UX) required by employees, partners and customers.
Application performance monitoring falls under the more general, related term application performance management. While application performance monitoring only focuses on tracking the performance of an application, application performance management focuses on the broader concept of controlling an app's performance levels. In other words, monitoring is a part of management.
An effective application performance monitoring platform should focus on infrastructure monitoring, as well as tracking the user experience, the performance and reliability of any dependencies and business transactions. APM tools provide administrators with the data they need to quickly discover, isolate and solve problems that can negatively affect an application's performance.
IT professionals can use the performance metrics -- which an APM tool gathers from a specific application or multiple applications on the same network -- to identify the root cause of a problem. The data collected by APM tools includes client CPU utilization, memory demands, data throughput and bandwidth consumption.
What is the purpose of APM?
The continued availability and appropriate performance of an application are essential to a company's ability to maintain uninterrupted business processes. This prevents unnecessary business disruptions and enhances customer satisfaction. An effective APM platform provides an organization with the ability to connect their app performance to their business outcomes, isolate and fix errors before they affect the end user and reduce the mean repair time.
APM tools gather and quantify data from almost anything that plays a role in an app's performance. At the foundation, application performance monitoring tools look at the application's hosting platform, mine information on process utilization and examine memory demands and disk read/write speeds. They also track processor utilization, which consists of the number of operations per second the CPU server performs.
If memory usage is high, application performance issues will arise. As a result, APM tracks how much short-term data a CPU stores.
At the software level, APM tools track error rates, or how often an application runs into a problem or fails. For example, an error can occur when there is not enough memory for the application to access. Application performance monitoring tools also monitor code execution to identify where there might be bottlenecks during memory-intensive processes, such as searching a database.
Automated load balancing has the potential to trick IT professionals into thinking everything is working properly because the combined performance of the servers appears to be fine. In reality, the automation could be masking issues where some servers are carrying more of the load than others. APM tools can help IT professionals avoid this issue by tracking all the servers at once to find out where a problem might be.
Why is APM important?
Application performance monitoring offers several benefits to the enterprise in terms of organizational effectiveness, reputation or brand and long-term cost efficiencies.
Organizational benefits include better cooperation and collaboration involved in application delivery. Front-end monitoring helps to oversee the application from the user's standpoint -- the user experience or UX. Back-end monitoring oversees the numerous services and dependencies used by the application, such as a critical database. And infrastructure monitoring -- either local or cloud-based -- helps ensure that all of the software applications can run on a well-configured and functional infrastructure. APM initiatives must break down these traditional silos for seamless and transparent application delivery.
The organization's reputation and brand benefit from reliable and available applications. If a user can't access an application or the application responds poorly -- if at all -- the user will be dissatisfied because they can't do their jobs, and the company's reputation will suffer. This can result in lower application utilization, slower application adoption and less revenue for the business. Ensuring that the application is working well is a wise strategy for any business that relies on its applications or software services.
The corollary to revenue is cost. It costs money to maintain and troubleshoot an application. An enterprise workload that functions poorly, experiences frequent software or infrastructure issues or poses availability challenges will incur costs to troubleshoot and remediate. Application monitoring helps identify problems for rapid correction. In some cases, prompt remediation can take place before users are even aware of an issue. The cost of APM can bring direct cost savings in unneeded application downtime and troubleshooting.
What are the components of APM?
Application performance monitoring focuses on tracking five primary components of app performance:
- runtime application architecture
- real user monitoring
- business transactions
- component monitoring
- analytics and reporting
Runtime application architecture. This aspect analyzes the hardware and software components used in the app's execution and the paths they use to communicate. Through pattern recognition and the identification of performance problems, IT professionals can anticipate the potential for future problems before they happen and plan for necessary upgrades -- such as more application storage -- in a timely manner.
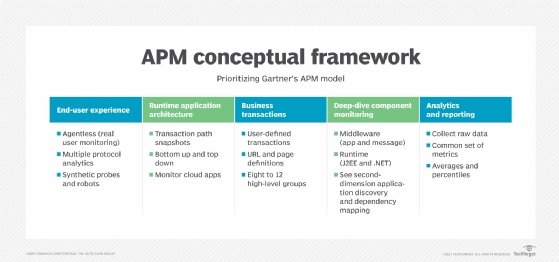
Real user monitoring. Also known as end user experience monitoring, this component gathers user-based performance data to understand how well the application is performing for users and to gauge potential performance problems. For example, APM might monitor the response time of a critical website and flag response times that exceed a comfortable threshold, alerting stakeholders of lag or application response issues. Real user monitoring enables an organization to efficiently respond to faults and understand their effect. There are two ways of tracking end user experience:
- Synthetic monitoring. This tracking method uses probes and bots to simulate an end user to determine problems before the app is opened. Synthetic monitoring is also used to monitor service-level agreements (SLAs) associated with the app.
- Agentless monitoring. This method uses data probes to analyze network traffic that travels through load balancers and switches. Agentless monitoring reveals information about performance throughout the entire infrastructure, as well as details on the analyzed client -- such as their location, OS and browser.
Business transactions. Also known as user-defined transaction profiling, this component focuses on examining specific user interactions and recreating them to test and understand the conditions that lead to a performance problem. This process helps organizations trace events as they move across the app's various components, as well as revealing when and where events are occurring -- and whether performance efficiency is optimized. This kind of profiling, along with component monitoring, is vital for effective troubleshooting in complex application environments.
Component monitoring. Also known as application component deep dive, this aspect involves tracking all components of the IT infrastructure. Extensive, in-depth monitoring is performed on all the used resources and experienced events within the app performance infrastructure. This includes an analysis of all servers, operating systems, middleware, application components and network components. Component monitoring provides a deeper understanding of the various elements and pathways identified in the previous processes.
Analytics and reporting. This aspect involves translating the data gathered from the above processes into information that can be used for the following:
- defining a performance baseline using historical and current data that sets an expectation for normal app performance;
- identifying potential areas of improvement by comparing infrastructure changes to performance changes;
- efficiently identifying, locating and resolving performance issues using historical and baseline data; and
- predicting and alleviating potential future issues using actionable insights.
The analytics and reporting components are essential to ensuring the organization receives a good return on investment (ROI) from both the application and APM.
How does APM work?
Application performance monitoring tools or platforms work by observing how apps are performing and whether they're behaving appropriately; if the apps aren't behaving appropriately, then data is collected on the source of the issue; the gathered data is analyzed in the context of its effect on the business; and the application environment is corrected to resolve any similar problems before they occur.
When configuring an APM platform, three categories of data should be considered:
- Metrics. A metric is a quantified measure that can be used to understand the status of a specific process. Metrics are often compared to a defined baseline to analyze the status of the system or process. Changing metrics are a common indication of an underlying issue.
- Traces. A trace is the complete processing of a request. It is used to illustrate and understand the complete journey of a request as it travels through all the components and services of the network. A trace contains hundreds of data points that can indicate errors, diagnose security threats and detect and isolate network issues.
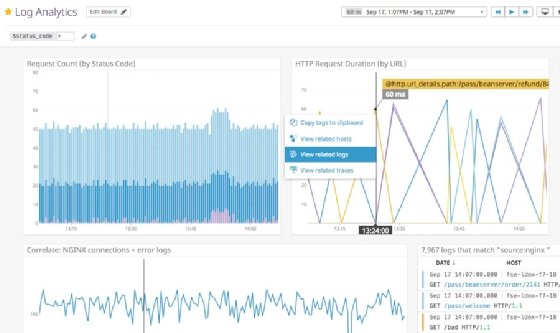
- Log files. Automatically created by an application or OS, they hold information about user behavior and events that took place on the app. Log files are used to perform root cause analysis, understand why a metric changed and identify where an event began.
Because performance monitoring is part of the broader performance management topic, it's important to note that monitored data and analytics might not be enough to ensure adequate user experience. Performance management systems will often combine monitoring data with automation and orchestration to bring a level of autonomy to some problem remediation.
For example, if a disk runs short of application storage capacity, the application might suffer performance or availability problems before an administrator can remediate the issue. In this example, a performance management system might use monitoring alerts and data to add more storage automatically, preventing application problems from ever occurring.
How is APM different from observability?
The terms application performance monitoring and observability are often used interchangeably, but they can diverge in scope.
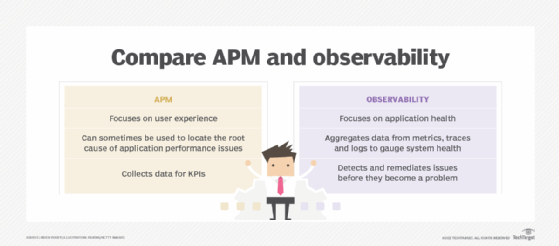
APM is about gathering data -- through metrics, traces and logs -- to measure performance and identify potential problems. On the surface, observability shares exactly the same definition. Observability defines or gauges a system's state based on the data that system generates. For relatively simple systems involving a handful of hardware in a limited physical deployment, APM and observability are indistinguishable.
However, observability typically goes further than APM. The fundamental difference between the two ideas is in how much data is collected and how that data is processed and interpreted.
Modern application architectures can be notoriously complex, involving large numbers of services and distributed systems located across multiple networks and physical locations, including the cloud. This evolution can present convoluted and challenging environments to monitor. Observability focuses on collecting more data across a broader range of environments and then performs sophisticated analytics on data patterns to provide insights on large and complex environments.
Key APM metrics
There are many possible metrics that can be employed to gauge the status of an application. Some of the most critical application monitoring metrics include the following:
- Web performance monitoring. This measures the average response time for end user interactions to see if speed is affecting app performance.
- Response time. Similar to web performance monitoring, this is the amount of time an application takes to return a request or query to a user.
- Resource usage. This metric monitors CPU usage along with disk read/write speeds and memory demands to see if usage is affecting app performance.
- Application availability and uptime. Measuring whether the app is online and available to users, it is frequently used to determine compliance with an organization's SLA.
- Request rates. This measures the amount of traffic received by the application to identify any significant increases, decreases or coinciding users.
- Customer satisfaction. This metric reveals how customers feel about the app compared to a defined baseline.
- Error rates. This metric observes how the app degrades or fails at the software level.
- Number of instances. Counting how many server or app instances are running at any one time is especially important for cloud applications.
Metrics such as availability are common and can be applied to many different apps. Other metrics, such as customer satisfaction, can be created or tailored to the specific needs or purpose of the application.
What are the benefits and challenges of APM?
In general, APM is used to proactively monitor the behaviors and performance of an application and its environment to identify and correct issues before the application is affected to any noticeable degree. It's a broad goal and it brings numerous tradeoffs to the organization. There are three major benefits to APM:
- Better collaboration. Metrics and collected data can spark cooperation and collaboration between traditional silos across an organization, helping create a leaner and more responsive business.
- Better CX. Improved customer experience occurs when applications and services are available and running well, helping to build the organization's reputation and brand.
- Cost savings. APM can help eliminate the costs of downtime and poor UX.
But APM can also place demands on stakeholders and pose the following challenges for the business:
- Using the wrong metrics. APM isn't automatic; it's up to the organization to choose and monitor the most meaningful metrics or create new metrics for the application being monitored.
- Not using the metrics collected. Metrics are useless if they're not used to oversee application behavior and performance. Collect data that is needed and use the data that is collected.
- Inadequate technical skill. Modern applications can be complex entities with many dependencies, so APM should be implemented and managed by staff that know the application, environment and APM technologies.
- Unclear stakeholders or goals. Stakeholders drive the goals. Understand what parameters of an application should be measured and why those parameters are important. Monitoring for its own sake has no value to the business or the user.
What can be monitored with APM?
IT professionals can create rules and select monitoring parameters so the APM tool alerts them when a problem arises or when an application's performance dips in a specific area -- or deviates from an established baseline. They can also prioritize applications based on how business-critical they are.
In virtualized deployments, APM tools can help IT professionals monitor application servers to ensure that they comply with an SLA.
The cloud introduces a host of additional dependencies into application performance, even when applications aren't based in the cloud themselves. For this reason, there is cloud application performance monitoring, which focuses on tracking the performance of applications based in private or hybrid cloud deployments.
For instance, an APM platform must monitor network communications to see if there is a communication problem between the application and any cloud services it requires to run, or between the application and the users themselves. To do so, many tools monitor both latency and the number of incoming and outgoing requests an application makes.
Application performance monitoring best practices
APM can be a complex and demanding undertaking. The notion of application performance isn't always clear. The tools and processes implemented to deploy APM demand careful thought, comprehensive testing and regular review. The following points can help a business get the most from APM:
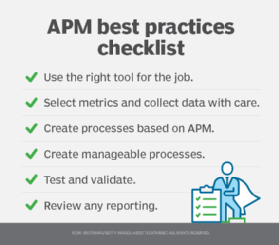
- Use the right tool for the job. Select APM tools based on the monitoring needs for the application and its operational environment. Simple APM tools might be inflexible or inadequate, while complex tools might be too difficult to manage or be underutilized. Shop around, use proof-of-principle testing and choose an APM tool that is most appropriate.
- Select metrics and collect data with care. More data isn't always better. Decide what data is most beneficial for the specific application and then implement APM to collect that and process the most relevant data.
- Create processes based on APM. Collecting data and sending alerts have no value if nobody knows what to do about it. Understand what happens when issues arise and develop processes and procedures to handle issues such as application downtime or performance disruptions as soon as they occur.
- Create manageable processes. Establishing a process, from generating alerts to crafting automated responses to issues, should be a dynamic effort that is revisited and updated on a regular basis as application and business needs change. Creating static processes and implementing APM tools that are hard to maintain can make APM efforts far more problematic for an organization.
- Test and validate. Make sure that any data and metrics collected by an APM tool are valid. Just because a business implements an APM tool doesn't mean that the tool is working. If the tool stops generating data, the issue should be addressed and resolved immediately.
- Review any reporting. Take the time to review reports and consider trends in the metrics. APM reporting can be a vital foundation for efforts such as infrastructure upgrades, capacity planning and even new software fixes and optimizations.
APM tools and top vendors
Organizations can choose from a wealth of APM tools -- either dedicated to APM tasks or with APM functionality built into a broader array of features. Some of the most popular tools for APM include both third-party and cloud-based offerings. These include the following:
- AppDynamics
- Azure Application Insights
- DX Application Performance Monitoring
- Datadog
- Dell Foglight
- Dynatrace
- eG Innovations
- Google Cloud Console
- Grafana
- LogicMonitor
- ManageEngine Applications Manager
- Microsoft System Center
- Nagios
- New Relic
- Opsview
- Pulse Secure Virtual Traffic Manager
- Red Hat OpenShift Container Platform
- Sematext APM
- Sensu
- Site24x7
- SolarWinds AppOptics
- Splunk
- Stackify Retrace
- Zenoss
Given the large number of potential tools, organizations should be sure to invest time and effort in feature evaluation and product selection.
Key features of APM tools
APM tools track an application's performance over time and help IT professionals understand the effect that different dependencies have on an application's performance. When choosing an APM tool, organizations should look for products that focus on ease of use, user experiences and the development of actionable insights from collected data.
In general terms, an APM tool also should be able to do the following:
- track performance at the code level;
- manage apps written in the company's chosen language;
- monitor the full infrastructure stack;
- identify connections between app performance and business outcomes; and
- take advantage of AI.
Consider some specific features in more detail. An APM tool typically lists the following capabilities in its feature set:
- server and other infrastructure monitoring and metrics;
- support for a wide range of metrics types;
- support for custom metrics;
- application log data;
- application error reporting for application defects and bugs;
- real user monitoring, including both client- and server-side metrics;
- web performance monitoring;
- synthetic monitoring, i.e., testing against pre-programmed application behaviors;
- load testing for evaluating scalability;
- root cause analysis for troubleshooting;
- AI-based analytics; and
- integrations with third-party services and applications.
Integrating APM in your business
There are lots of APM tools, but tools alone don't make a successful APM initiative. Business and technology leaders should consider an array of questions before embarking on APM adoption. Typical considerations include the following:
- Are there applications or services that would benefit from performance monitoring? These are typically mission-critical workloads that the business depends upon, and where disruption would affect the business.
- What data is most relevant to that application or service? Understand what metrics or data should be acquired for the workload. Chances are that an APM tool can produce far more data than needed, so be selective about what the business really needs to see.
- What analytics, alerting or reporting is appropriate? Understand how metrics and data should be processed, who is responsible for handling alerts, what reports should include and the kinds of insights required from analytics.
- How should the APM tools be used? Think about the APM process, such as receiving alerts or implementing automated responses.
- Who owns APM? Consider the stakeholders involved in an APM deployment, from application owners to IT administrators. Decide who has responsibility for the APM initiative.
- What APM tools meet these criteria? Evaluate prospective APM tools against the requirements and create a short list of potential candidates for evaluation.
- Can the APM tool work within the environment? Use proof-of-principle testing to evaluate APM tools and validate their ability to meet established requirements -- such as AI analytics, custom metrics or cloud integration. Verify that the tools are suited to the existing environment and have no unusual or unplanned dependencies.
- How can APM plans be changed? Consider the ease of use in terms of changing metrics, creating custom metrics and accommodating new use cases. Understand how prospective tools and processes can adapt to changing business needs into the future.
With these questions answered, a business can make decisions to move forward with an APM deployment. It's often best to start small -- with a single application or service -- develop expertise with the APM tool and practice, and then systematically expand APM use as required.